Carrier Distribution Report
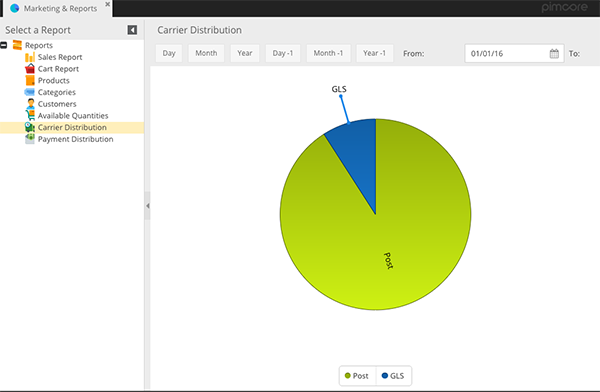
The CoreShop Carrier Distribution Report provides a visual representation of how different carriers are utilized for shipping in your e-commerce store. This report, presented as a pie chart, is crucial for analyzing shipping preferences and efficiency.
Report Format
The report is displayed as a pie chart, offering a clear visual breakdown of carrier usage.
| Type | Has Pagination |
|---|---|
| Pie Chart | No |
Customizing the Report with Filters
Apply various filters to refine your data analysis:
| Name | Description |
|---|---|
| Store | Filter by specific Store. |
| Day | Filter for transactions on the current Day. |
| Month | Filter for transactions in the current Month. |
| Year | Filter for transactions in the current Year. |
| Day -1 | Filter for transactions on the previous Day. |
| Month -1 | Filter for transactions in the previous Month. |
| Year -1 | Filter for transactions in the previous Year. |
| From | Start date for the filter period. |
| To | End date for the filter period. |
Chart Fields
The Carrier Distribution Report includes the following field:
- Carrier Distribution: This field visualizes the proportion of each carrier used for shipping orders, helping you to understand which carriers are most popular or efficient for your store.