Sales Report Overview
The CoreShop Sales Report provides a comprehensive analysis of sales data, enabling you to track and understand sales trends over different time periods.
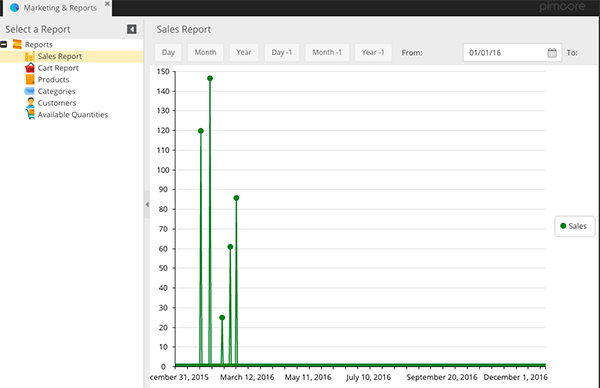
Report Format
The Sales Report is presented in a Cartesian Chart format.
| Type | Has Pagination |
|---|---|
| Cartesian Chart | No |
Filters for Tailored Analysis
Customize your sales data view using a variety of filters:
| Name | Description |
|---|---|
| Store | Filter sales by specific Store. |
| Day | Filter sales for the current Day. |
| Month | Filter sales for the current Month. |
| Year | Filter sales for the current Year. |
| Day -1 | Filter sales for the previous Day. |
| Month -1 | Filter sales for the previous Month. |
| Year -1 | Filter sales for the previous Year. |
| From | Start date for the sales filter period. |
| To | End date for the sales filter period. |
| Group By | Group sales data by Day, Month, Year. |
Chart Data Fields
The sales chart includes the following data fields:
| Name | Description |
|---|---|
| Y | Total Sales Amount. |
| X | Date of Sales. |